
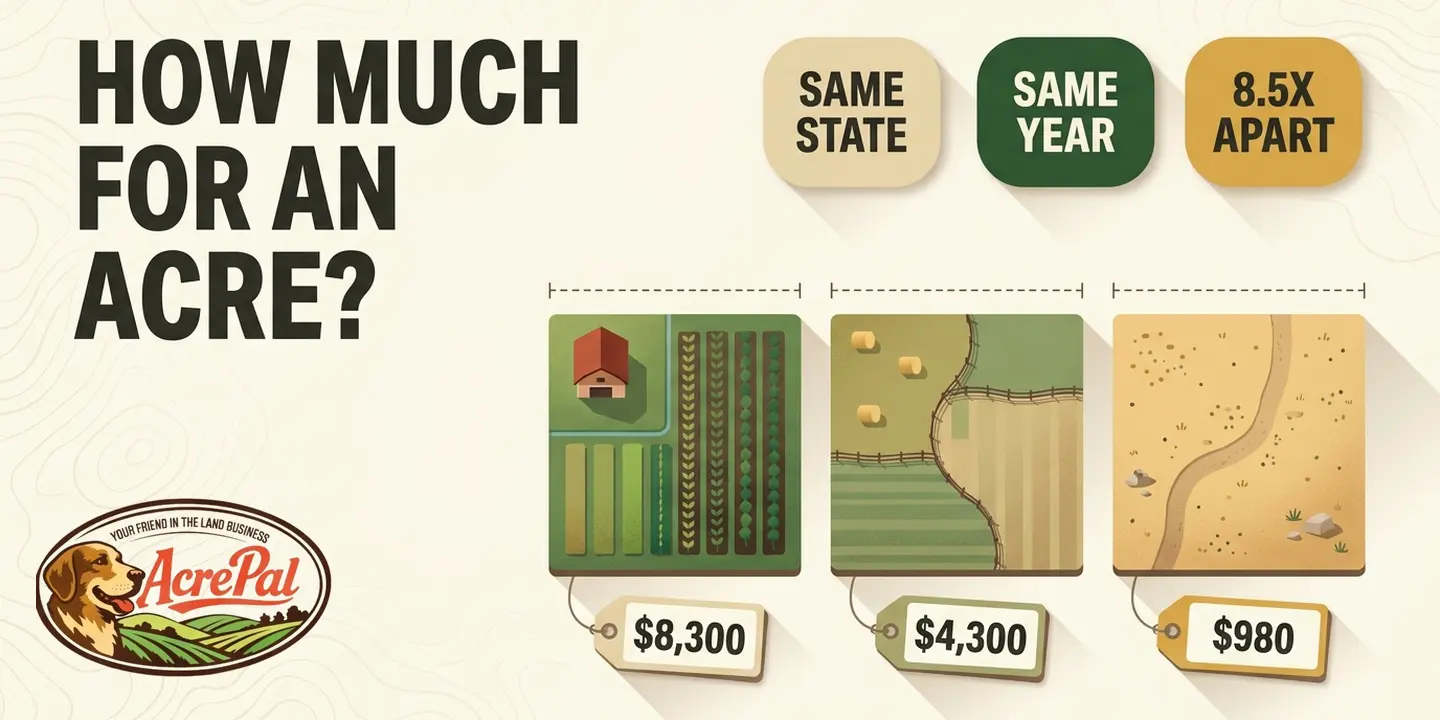
Ask the internet how much for an acre and you get four answers before you finish your coffee. Orchard says $3,160, attributed to the USDA, on a page last updated July 18, 2022. Mossy Oak Properties says $4,350, the USDA's 2025 figure. bhumicalculator says $13,000 for 2026 with no source on any row of its table, and LandSearch says around $18,000, which it calls current marketplace inventory.
That is a 5.7 to 1 spread on a four word question, by our own division of the highest published figure by the lowest. It is not because three of them are lying.
The same thing happens when nobody is being sloppy. Three institutions priced Texas land in 2026.
- USDA NASS, 2026 farm real estate, $3,100 per acre
- Federal Reserve Bank of Dallas, first quarter 2026 ranchland, $4,859 per acre
- Texas A&M Real Estate Research Center, first quarter 2026 verified sales, $5,246 per acre
None of the three is wrong. Each measured a different asset and gave it the same four word label. That is this article in one line.
The honest short answer is USDA's 2026 farm real estate value of $4,500 per acre, released in July 2026, up $150 from 2025. Then USDA disqualifies it in its own first sentence, calling it "a measurement of the value of all land and buildings on farms". If you are buying a raw acre with no farm and no buildings, that is not your number.
So this page gives you three other things. What each published number measures, so you can pick the one that fits. A reference table showing USDA's three different per acre figures for every state. And a repeatable way to pull a real recorded sold price in your county.
Three Institutions Priced Texas Land in 2026 and Got Three Different Numbers
One state. One year. Three publishers who all show their work and all disagree. Here is what each printed for Texas.
- USDA NASS, Land Values 2026 Summary, Texas farm real estate, $3,100 per acre
- Federal Reserve Bank of Dallas, Agricultural Survey first quarter 2026, Texas ranchland, $4,859 per acre, up 6.9 percent year over year
- Texas A&M Real Estate Research Center, Texas Rural Land Markets first quarter 2026, statewide, $5,246 per acre, up 6.02 percent year over year
USDA's $3,100 is farm real estate value, which the report defines as "a measurement of the value of all land and buildings on farms". The barn counts. The value is not taken from a sale either, it is estimated by farm operators themselves in an annual survey.
The Dallas Fed's $4,859 is ranchland specifically, and it comes from agricultural bankers rather than owners or deeds. The survey states its own basis plainly, "Data were collected March 3-11, and 59 bankers responded to the survey." Those bankers sit across the Eleventh District, covering Texas, northern Louisiana and southern New Mexico. The same survey's Texas sub-regions run from Northern High Plains ranchland at $1,083 per acre, down 23.0 percent, to North Central Texas at $8,000 per acre, up 2.4 percent, so the headline figure is an average stretched across a range that wide.
Texas A&M's $5,246 is the only one of the three built from transactions instead of opinions. Its stated method reads, "Nominal price per acre is the four-quarter, moving median price per acre segmented by size of property sold in each region. Statewide prices are a weighted average of those regional prices." The report describes its input as "a sample of verified transactions" covering "large rural land tracts." Published May 26, 2026.
From $3,100 to $5,246 is a 69 percent gap on one state in one year, and that percentage is our own division of two published figures, not a statistic either publisher claims. None of the three is wrong. Each is precisely correct about the thing it measured, and none measured the thing all three get labeled as.
Land is not one asset. A quarter section of irrigated cropland with a barn on it, a working cattle ranch, and a five acre off grid parcel with a dirt track to it are separate markets that happen to share a unit of measurement. Averaging across them produces a number that describes none of them.
Texas is worth a closer look than one state can get here, partly because it is a non disclosure state where no sale price is public record. Our guide to what an acre of land costs in Texas goes region by region.
What the USDA's $4,500 Per Acre Actually Measures
Almost every page competing for this question quotes USDA. Almost none explain what the number is. The July 2026 report opens with this. "The United States farm real estate value, a measurement of the value of all land and buildings on farms, averaged $4,500 per acre for 2026, up $150 per acre (3.4 percent) from 2025."
Cropland averaged $6,020 per acre, up $190, and pasture $2,000, up $80. Note the year, because most pages quoting a national average are still on the 2025 figure of $4,350.
It is an opinion survey, and that single fact changes how you read every number in it. USDA's methodology says the estimates are "based primarily on the Agricultural Land Values Survey conducted from April to June." and that "A sample of approximately 30,000 operations were included." Enumerators "also collect an estimated value of all land and buildings for the operator's entire farming operation". In plain terms, 30,000 farm operators were asked what they think their own place is worth.
That is a serious, nationally representative survey of opinions. It is not a record of what anything sold for.
It also includes the buildings. Barns, shops, grain bins and the farmhouse all sit inside the average. Raw or unimproved acreage has none of that, so a raw land buyer is measuring against somebody else's construction.
It is weighted toward farms. The estimates are, in USDA's words, "weighted by the amount of cropland and pasture in each State", so the result structurally cannot describe a residential or recreational acre. That is no criticism of USDA, which does what its label says, but of everybody borrowing the number for a job it was never built to do.
It leaves things out, and the footnotes are where that hides. Footnote 2 on the United States row reads, "Excludes Alaska and Hawaii.", so the table carries 48 state rows, not 50. Footnote 1 on Arizona, Nevada, New Mexico and Utah reads, "Excludes American Indian Reservation land.", a material carve out in four western states where plenty of raw land shopping happens.
Some cells are blank on purpose, and some numbers change after publication. "(D) Withheld to avoid disclosing data for individual operations." explains the gaps, and USDA warns that "For non-census years, land values are subject to an annual revision the following year.", so a figure quoted last year may since have changed at the source.
USDA is the most rigorous land price publisher in the country, and its number still is not your number. The table below shows why.
USDA Publishes Three Different Prices Per Acre for Your State
USDA does not publish one number for your state. It publishes three, and they are not close together.
Arizona is the cleanest example. Its farm real estate figure is $4,300 per acre, its cropland figure is $8,300, and its pasture figure is $980. That is an 8.5 to 1 spread inside one state, one dataset and one year, by our own division of the highest of the three by the lowest. Nevada splits the same way further down the scale, at $1,230, $3,090 and $870.
Texas sits at $3,100 in the farm real estate column, which is the same USDA figure weighed against the Dallas Fed and Texas A&M earlier, and the lowest of those three.
The three columns measure different ground. Cropland is the irrigated and tillable acreage that grows a crop and usually has water attached. Pasture is grazing land, and it is the closest thing in this table to unimproved rangeland. Farm real estate is the whole operation with the buildings included.
If you are looking at a raw desert acre with no well and no power, read down the pasture column. It will still be an approximation, because a grazing lease across 640 acres is not a five acre parcel with a road to it. The national spread is wider still, running from New Mexico at $735 to Rhode Island at $23,600 in the farm real estate column alone, roughly 32 to 1 by our arithmetic.
| State | Farm real estate | Cropland | Pasture |
|---|---|---|---|
| Alabama | $4,250 | $4,650 | $3,500 |
| Arizona | $4,300 | $8,300 | $980 |
| Arkansas | $4,350 | $3,850 | $3,500 |
| California | $14,100 | $18,430 | $4,250 |
| Colorado | $2,360 | $2,960 | $1,200 |
| Connecticut | $14,600 | $23,200 | $13,000 |
| Delaware | $9,700 | $9,550 | $7,800 |
| Florida | $9,150 | $11,100 | $7,650 |
| Georgia | $4,950 | $4,670 | $5,100 |
| Idaho | $4,750 | $6,170 | $2,500 |
| Illinois | $9,250 | $10,200 | $4,300 |
| Indiana | $9,150 | $8,600 | $2,850 |
| Iowa | $10,100 | $10,700 | $3,800 |
| Kansas | $3,200 | $3,540 | $2,400 |
| Kentucky | $5,600 | $6,630 | $4,050 |
| Louisiana | $3,950 | $3,660 | $3,600 |
| Maine | $3,400 | $4,700 | $2,700 |
| Maryland | $9,950 | $9,250 | $8,300 |
| Massachusetts | $15,200 | $26,600 | $15,400 |
| Michigan | $7,000 | $6,600 | $3,200 |
| Minnesota | $6,950 | $7,300 | $2,400 |
| Mississippi | $3,650 | $4,060 | $3,310 |
| Missouri | $5,200 | $5,310 | $2,850 |
| Montana | $1,260 | $1,350 | $940 |
| Nebraska | $4,400 | $6,960 | $1,590 |
| Nevada | $1,230 | $3,090 | $870 |
| New Hampshire | $6,670 | $10,100 | $8,120 |
| New Jersey | $17,000 | $17,100 | $15,600 |
| New Mexico | $735 | $2,090 | $650 |
| New York | $4,500 | $4,150 | $2,040 |
| North Carolina | $5,750 | $5,580 | $6,380 |
| North Dakota | $2,450 | $2,800 | $1,200 |
| Ohio | $9,650 | $10,100 | $4,250 |
| Oklahoma | $2,620 | $2,560 | $2,200 |
| Oregon | $3,880 | $4,540 | $1,120 |
| Pennsylvania | $8,700 | $9,800 | $4,350 |
| Rhode Island | $23,600 | $34,300 | $17,500 |
| South Carolina | $4,900 | $4,100 | $4,500 |
| South Dakota | $3,100 | $4,770 | $1,400 |
| Tennessee | $6,500 | $6,400 | $5,910 |
| Texas | $3,100 | $2,790 | $2,420 |
| Utah | $3,650 | $6,040 | $2,000 |
| Vermont | $4,490 | $4,450 | $2,920 |
| Virginia | $6,300 | $6,400 | $5,430 |
| Washington | $3,800 | $3,540 | $980 |
| West Virginia | $3,640 | $4,400 | $2,400 |
| Wisconsin | $6,700 | $7,600 | $3,500 |
| Wyoming | $1,030 | $2,080 | $770 |
| United States | $4,500 | $6,020 | $2,000 |
Read that table with its caveats attached. It carries 48 state rows and not 50, since footnote 2 excludes Alaska and Hawaii. Arizona, Nevada, New Mexico and Utah exclude American Indian Reservation land under footnote 1. And every figure in it is a farm operator's own estimate of land and buildings, not a price anybody paid.
This is reference data and nothing more. We are deliberately not ranking these states, not calling any of them cheap or expensive, and not telling you where to buy, because a farm weighted survey average is the wrong instrument for that question. Our post on the cheapest place to buy land does that comparison properly.
What the table is good for is a sanity check, and the tool below runs that check for you against all three figures at once.
The Best Dataset Available Still Does Not Describe a One Acre Buy
Texas A&M's Real Estate Research Center publishes the number we trust most here, and it still cannot price your acre.
TRERC builds its figures from recorded sales, not from anybody's estimate, using the four-quarter moving median quoted above. The input is "a sample of verified transactions" covering "large rural land tracts." Statewide for the first quarter of 2026 that came to $5,246 per acre, up 6.02 percent year over year.
Now the limitation, which TRERC states in the same report. The statewide median tract size behind that $5,246 is 1,573 acres, or roughly two and a half square miles. The best land price data in this article does not describe a one acre purchase, or a forty acre one.
Inside Texas, those sales spread out like this.
- Far West Texas, $630 per acre
- Panhandle-South Plains, $1,828
- West Texas, $2,947
- South Texas, $6,277
- Austin-Waco-Hill Country, $8,028
- Northeast Texas, $8,960
- Gulf Coast-Brazos Bottom, $11,698
That is roughly 18.6 to 1 inside one state in one quarter, our arithmetic on the highest and lowest of those figures, and it comes from deeds rather than opinions. A statewide average is an average of that. It cannot price a county, and a county average cannot price a parcel.
Tract size is the one price factor here we can attach a sourced number to. TRERC's most recently published small versus large tract comparison, stated for the first quarter of 2023, put the bottom 20 percent of tracts by size at $9,373 per acre against $4,547 for the upper 80 percent, or "206.1 percent of the corresponding large property price". Median size in that small tract group was 24.29 acres.
That snapshot is dated 2023 inside a current report, and it is Texas, so treat it as a relationship rather than a rate. A banker in the Dallas Fed's South Texas region said the same in the first quarter 2026 survey, "Demand for small ranch tracts is good and continues to bring premium prices."
Price per acre moves inversely with tract size, so any figure from large tract data understates what a small parcel costs. Our post on how much 50 acres of land costs works through how that scales, and 3 acre pricing covers the small end.
Where the Other Published Numbers Come From
We traced every national figure on the eight ranking pages back to its origin. Four categories. Stale copies of an older official number, current farm survey data, active listing inventory, and blended proprietary estimates. Orchard's $3,160 sits on a page last updated July 18, 2022.
Mossy Oak Properties earns real credit here. It is the only page in this set that tells readers plainly that the USDA figure is not sales data, the most useful sentence any competitor writes here. Its Federal Reserve citation is exact too. We checked AgLetter No. 2012, Federal Reserve Bank of Chicago, May 2026, which reports a 3 percent year over year rise in Seventh District agricultural land values and that "56% of survey respondents considered farmland to be overvalued, while just 1% considered it undervalued."
The missing context is that those are 104 agricultural lenders' opinions covering the Seventh District only, Illinois, Indiana, Iowa, Wisconsin and most of Michigan, so the figure is neither national nor about raw land. The AgLetter also notes its results now come from "commercial banks and Farm Credit System institutions", where everything before the first quarter of 2026 came from commercial banks alone, so the comparison is not fully like for like.
The one thing we can show is wrong is specific. The page describes the USDA figure as coming "from a survey of roughly 9,000 tracts conducted in early June". USDA says approximately 30,000 operations, from April to June, so both the sample size and the window are off.
Asking prices behave differently. LandSearch's $18,000 per acre is current marketplace inventory, and unsold inventory skews high because anything priced correctly leaves the pool. bhumicalculator's $13,000 cites no source at all.
Then the vintage problem. worldpopulationreview publishes a page titled "Acre Value by State 2026" whose table column is headed "Farmland Price Per Acre 2025". We matched all 46 parsed rows against the USDA 2026 summary and 45 matched the 2023 column exactly. Its body text cites 2022 NASS figures instead, and another section cites Zippia for New Jersey at $196,410.
The last category is the blended estimate. RealtyTimes published a 50 state dataset in February 2026, New Mexico at $2,200 and Massachusetts at $65,000, sourced to SellTheLandNow. Credit where it is due, SellTheLandNow publishes a methodology naming USDA, Federal Reserve credit surveys, listing data and development signals, and discloses that it connects landowners with investors who buy vacant land.
Three criticisms survive it. The relative weight of those inputs is never stated, so the result cannot be checked. The figures describe a self defined development stage tier tied to no single actual transaction. And RealtyTimes republishes them without the tier label or the fact that the source company buys land.
New Mexico has been published as $610 and as $2,200 against USDA's current $735, and Rhode Island as $17,500 and $21,000 on one page. Same states, same question, and every one of those figures is live and reachable today.
A Reality Check Tool for the State You Are Buying In
Most calculators on this topic multiply an average by your acreage and hand back a number with a dollar sign on it. That number looks precise and is not, and building one here would turn this page into the thing it criticizes.
There is no sourced national adjustment for legal access. There is none for power at the road. No modern study we could find quantifies either one, so putting a percentage in the math would be dressing up a guess as a calculation.
What a tool can honestly do is smaller and more useful. It shows you all three of USDA's 2026 figures for your state at once, names what each one measures on the same line as the number itself, and applies the one tract size relationship here that traces back to actual recorded sales. Pick your state and your rough parcel size, then read the width of the range as the real answer.
Legal access or landlocked status. No modern peer reviewed study quantifies the discount. Practitioner estimates run from roughly 30 to 80 percent, which is too wide to compute with.
Power at the road. No source we found quantifies the value it adds. What can be priced is the cost to bring it in, which is a different number.
Zoning, water rights, topography, soil, entitlement status, road surface and season of access.
Treat what comes back as a sanity check rather than a valuation. If a listing you are looking at is priced at or below your state's pasture figure, the asking price is at least plausible for raw ground with nothing on it.
If it sits well above the farm real estate figure, there is a reason, and finding it should come before deciding the price is a bargain or a ripoff. Usually it is entitlement, utilities already run to the property, a recorded subdivision, or development pressure from a nearby town. Rarely is it the dirt itself.
Neither result is a price for your parcel. For that you need a real recorded sale nearby, and the section below shows you how to get one.
What Actually Changes the Price of One Specific Acre
Every page competing for this question lists the same factors. Location, access, utilities, water, zoning, soil and size. None attaches a number to any of it. What we failed to find matters more than what we found.
Tract size is the one we can source, and the section above has it. TRERC's recorded sales put small tracts at 206.1 percent of the large tract price per acre in its first quarter 2023 snapshot.
Legal access is probably the largest value factor in raw land, and no modern peer reviewed study quantifies the landlocked discount. We looked hard. What exists is practitioner experience rather than research, in two shapes.
The first is a working consensus among land professionals that a landlocked parcel trades roughly 30 to 80 percent below a comparable parcel with recorded access. That range is too wide to compute with, and we will not average it into a tidier number. The second is one dollar verified case from a named certified appraiser on a professional forum, where a landlocked five acre parcel was discounted 50 percent to $75,000 against a $150,000 accessible comparable.
The takeaway is behavioral, not numeric. Confirm recorded legal access in writing before price is even a conversation. Our posts on landlocked property and rights of way cover what to check.
Power at the road is the same story with less to show. No source we found quantifies what utility access adds to a raw parcel. The only genuine academic work is Lewis and Severnini, Journal of Development Economics, 2020, a study of the 1930 to 1960 US grid rollout that supports only the direction of the effect, in 1930s dollars. What can be priced is the cost to bring power in, which belongs with utility costs on land and well and septic costs.
Zoning sets the ceiling, because what you may legally do with a parcel caps what anyone will pay. Our post on zoning covers the categories.
An honest admission that a number does not exist beats a plausible one. That is why the tool above refuses to give a single figure.
Why Raw Rural Acres Often Trade Below Every Published Average
California is the fifth most expensive state in USDA's 2026 farm real estate table, $14,100 per acre. Raw, unimproved, off grid acreage in Modoc County, in the far northeast corner of the state, does not trade near that.
Both are true at once and neither is a scam. The state figure is weighted by cropland and pasture acreage, so it is dominated by irrigated Central Valley ground with buildings on it. Same state, different asset, same label.
The figure most pages publish as the price of an acre is the national farm real estate value of $4,500. USDA's 2026 pasture value is $870 per acre in Nevada, $980 in Arizona and $650 in New Mexico. The American average runs about five times USDA's own grazing land measure in Nevada and nearly seven times it in New Mexico, our arithmetic from one report in one year.
Pasture is the closest USDA gets to unimproved rangeland, and almost nobody quotes it.
We sell owner financed raw land ourselves at AcrePal, in six counties across Arizona, Colorado, Nevada, California and Florida, so read what follows as an interested party's observation rather than a neutral one. Parcels with no utilities, no improvements and seasonal access clear well below the state farm real estate figure, and the gap is the improvements, not the geography. Owner financing is common here, and owner will carry, no money down and our land loan calculator cover how it works.
We owe you a negative result on our own backyard. We went looking for verified sold prices per acre in those counties and could not get them. The aggregators publish asking prices, and the same county returns a different average depending on which cut of the data you pull, so none of it is checkable enough to print. The recorded deed is the only number in this article that nobody is estimating, which is why the next section exists.
How to Pull a Real Sold Price Per Acre in Your Own County
The only number that truly answers this for a specific parcel is what a comparable parcel nearby sold for. In a disclosure state that is often public record, sometimes recoverable from the tax stamped on the deed.
Florida is the cleanest example because the rate is fixed by statute. Florida Statutes section 201.02(1)(a) sets the documentary stamp tax, in its own words, "on each $100 of the consideration therefor the tax shall be 70 cents". That is 0.7 percent, so the sale price is the stamp tax divided by 0.007.
Four steps, all from a laptop.
- Find a comparable parcel nearby that sold recently.
- Search the county Clerk of Court's official records portal by name, parcel ID, or book and page.
- Read the documentary stamp tax on the recorded deed.
- Divide that amount by 0.007, then by the acreage on the property appraiser's record.
That is a real, dated, recorded price per acre for one transaction. Not a survey estimate, not an asking price.
Hedge it the way the statute does. It says consideration "includes, but is not limited to, the money paid or agreed to be paid... or other encumbrance", so a back calculated figure can include non cash items. Confirm with your county clerk, and do not assume the rate carries to other states. Our post on plat maps covers finding the parcel and its acreage.
Whether this works where you live depends on your state, and the data companies disagree on which states qualify.
- PropStream lists twelve. Alaska, Idaho, Kansas, Missouri in some counties, Mississippi, Louisiana, Wyoming, Utah, Texas, North Dakota, New Mexico and Montana.
- A separate cluster of consumer lists instead names Texas, Utah, Idaho, Wyoming, Montana, New Mexico, Oklahoma, North Dakota and South Dakota, with Arizona and Washington as hybrids. That cluster came through search synthesis rather than page by page fetching, so treat it as weaker.
They disagree on membership, not merely count. PropStream includes Missouri and Mississippi and leaves out Oklahoma, South Dakota, Arizona and Washington. Check yours against more than one source.
If the data companies cannot agree on which states publish sale prices, a confident national average per acre deserves the same scrutiny. Sellers pricing their own land should see what your land is worth.
How Much Land Is in an Acre
One acre is 43,560 square feet. That is 4,840 square yards, or about 0.4047 hectares. The usual comparison is a US football field with the end zones taken off.
The part that matters for price is that an acre is an area and not a shape. It can be a square of roughly 208.7 feet on each side, or a long narrow strip running along a road, and those two parcels are not worth the same money. Road frontage, depth, and whether the buildable portion sits above the floodplain do more to set a small parcel's value than the acreage figure does.
None of that changes the acreage. It changes what the acre is worth.
For the conversion math in full, see how to calculate acres. For pricing at the small end, see how much 3 acres of land costs.
Frequently Asked Questions
How much is 1 acre of land?
There is no single national price. The most current official figure is USDA's 2026 farm real estate value, $4,500 per acre, but USDA calls that the value of all land and buildings on farms, so it does not describe a raw acre. USDA's national pasture value of $2,000 is closer to unimproved rural ground. Both are averages across a 32 to 1 spread between states.
How much land is in an acre?
One acre is 43,560 square feet, or 4,840 square yards, or about 0.4047 hectares. Laid out as a square, that is roughly 208.7 feet on each side. An acre is an area and not a fixed shape, so two one acre parcels can look nothing alike.
How much does an acre cost in Texas?
Three institutions published different Texas figures for 2026. USDA NASS puts farm real estate at $3,100 per acre, the Dallas Fed's first quarter 2026 survey of 59 bankers puts ranchland at $4,859, and Texas A&M's Real Estate Research Center puts statewide land at $5,246 from verified recorded sales.
How much is an acre of land in Arizona?
USDA's 2026 summary gives Arizona three different figures, $4,300 per acre for farm real estate, $8,300 for cropland and $980 for pasture. That is an 8.5 to 1 spread inside one dataset, our own arithmetic on the highest and lowest. Arizona's figures also exclude American Indian Reservation land under USDA's footnote. For raw desert acreage, pasture is the closest reference point.
How much is an acre worth?
Worth depends on what the acre is, not where the national average sits. The factors that move it most are recorded legal access, utilities, what the zoning permits, and tract size. Only tract size has a sourced number, and Texas A&M found small tracts at 206.1 percent of the large tract price per acre in its first quarter 2023 comparison. If you are pricing land to sell, see what your land is worth.
Why does every website give a different price per acre?
Because they are measuring different assets under the same label. Published national averages currently run from $3,160 to $18,000 per acre. The gap is farmland with buildings, versus ranchland, versus recorded sales of very large tracts, versus asking prices on listings that have not sold, plus pages republishing figures several years old under a current date.
Why is land so expensive?
Supply is fixed and the usable portion is smaller still. Most of the price of an expensive acre is not the dirt, it is access, utilities, entitlement and what the zoning allows. USDA's national cropland value of $6,020 per acre runs three times its pasture value of $2,000 for that reason.
Can I find out what an acre actually sold for near me?
Often yes, in a disclosure state. Florida stamps a documentary tax on the deed at 70 cents per $100 of consideration under section 201.02(1)(a), so dividing the stamp amount by 0.007 recovers the sale price, then divide by the acreage. Confirm the mechanism with your county clerk. Published lists of non disclosure states genuinely disagree, so check yours against more than one.